
Turning weather intelligence into business intelligence
Every food producer in New Zealand is hearing the same message: there’s a strong El Niño coming. The challenge isn’t knowing that El Niño exists. The challenge is understanding what it means for your growers, your suppliers, your production volumes, and your supply chain.
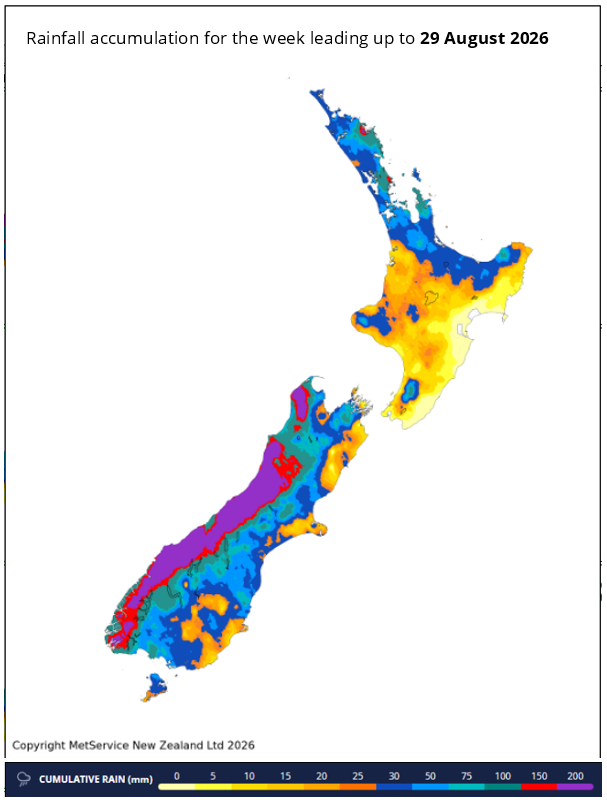
Looking at this map it is easy to see rainfall differences across New Zealand. What isn’t obvious is what those differences mean for production. Twenty millimetres of rain might make little difference to one farming system but could significantly affect pasture growth, harvest timing or stock movements in another. Understanding those implications is where weather intelligence becomes business intelligence.
That knowledge gives organisations more time to plan procurement, processing capacity, grower communications, inventory and logistics before conditions begin to affect supply.
Location and consequence matter
What a high-country sheep farmer in Canterbury will experience is very different to one on the Canterbury Plains. So too a grower near the coast in Manawatu compared to one further inland, or a dairy farmer in western Waikato compared to one further east.
A regional forecast isn’t always enough to assess the impact on a supply chain.
To help with that Prism has teamed up with Metservice to provide a detailed six-month forecast service tailored to specific production systems or supply chains.
During the monthly online briefing session expert Metservice forecasters provide an explanation of the science that is driving our weather and what it means for the forecast in the locations that matter. Prism then translates that science into production and supply-chain implications.
Looking back helps us to look forward
A key part of this service is understanding how previous strong El Niño events like 1982/83, 1997/98, or 2015/16 played out in specific locations. Metservice have an incredible set of hindcast data, with hourly weather measures going back over 55 years to the start of 1970, at locations on a 4km grid over the country. This data goldmine allows Prism to analyse for a particular place how temperature, humidity, rainfall, wind and soil moisture in a previous strong El Niño season impacted production measures like animal condition or pasture growth.
While no El Niño event is the same, there are often common patterns and they give us a more than a hint about how this coming season may play out, and therefore what actions may be needed across a food production supply chain.
Prism then provides production system or supply chain insights that explore how the weather forecast is likely to make a difference, anywhere from a single location to a whole national supply chain. For example, will rainfall reduce lamb growth rates in Southland, delay harvest in Hastings, increase supplementary feed demand in Manawatu, or shift cattle kill dates in Northland.
Things change, stay up to date
These Metservice-Prism briefings don’t have to be one-and-done though, with monthly update briefings staying right up to date with the latest conditions and forecasts and providing a focus on the things that matter to a specific production system or supply chain. All with the chance to get the answers that matter straight from the forecasters.
For organisations whose supply, production or processing volumes and timing are weather dependent, then understanding what El Niño means for your specific locations can provide critical planning time before conditions begin to bite.